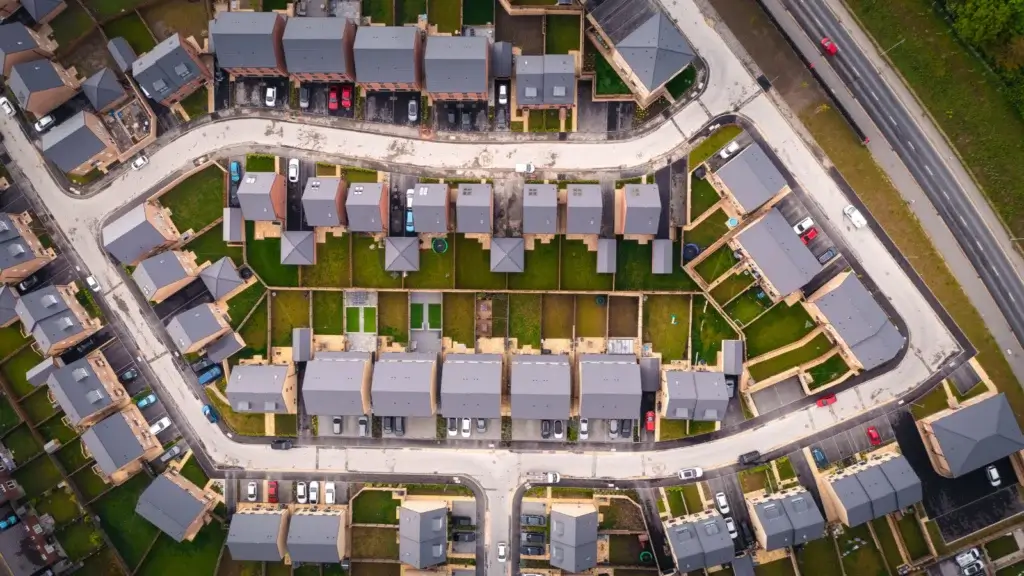
Sales of new builds were up just 0.1% in February, according to the latest data; however, there is no evidence of an immediate downturn.
Of the 82,268 sales received for registration in February 2019, 16,157 were newly built, a 0.1% increase on February 2018. However, according to the LSL New Build Index, this indicates that the market is topping out following a steady increase over the past seven years. “There does not seem to be any evidence showing the seeds of a sudden market down turn, more a levelling off,” it said.
In the year to end Feb 2019 new build prices per m² rose by an average of 3.68% across the UK, according to the LSL New Build Index.
An analysis of new build mortgage valuation data shows that across the North, average new build prices per square metre were just over 5% higher than the same time last year. In the South the figure was a little over 2% higher.
The Index looked at the relationship between average earnings at regional level and the average price of a 70 m2 – Gross External Area starter home, illustrating the wide regional variation in affordability. Greater London, East Anglia, the South East and the South West all have high House Price Earnings ratios whilst other regions that are now seeing the highest rates of house price growth have lower HPE ratios, indicating greater levels of affordability.
This follows the broader trends in the property market. According to Nationwide’s latest House Price Index, annual house price growth remained subdued at 0.7% in March. there was a modest 0.2% price rise during the month, after taking account of seasonal factors. Prices fell in London and the South East.
Robert Gardner, Nationwide’s Chief Economist, said, “UK house price growth remained subdued in March, with prices just 0.7% higher than the same month last year.
“Indicators of housing market activity, such as the number of property transactions and the number of mortgages approved for house purchase, have remained broadly stable in recent months, even though survey data suggests that sentiment has softened.
“Measures of consumer confidence weakened around the turn of the year and surveyors report that new buyer enquiries have continued to decline, falling to their lowest level since 2008 in February.
“While the number of properties coming onto the market has also slowed, this doesn’t appear to have been enough to prevent a modest shift in the balance of demand and supply in favour of buyers in recent months.
“Northern Ireland remained the strongest performing home nation in Q1, although annual price growth softened to 3.3%, from 5.8% last quarter. Scotland saw a slight pick up in annual price growth to 2.4%, while Wales saw a marked slowing in growth to 0.9% (from 4.0% last quarter).
Meanwhile, England recorded its first annual price fall since 2012, with prices down 0.7% compared with Q1 2018, driven by declines in the South East of England.
“London was the weakest performing region in Q1, with prices 3.8% lower than the same period of 2018 – the fastest pace of decline since 2009 and the seventh consecutive quarter in which prices have declined in the capital,” Gardner said. “This trend is not entirely unexpected, however, as it follows several years of sustained outperformance which left affordability more stretched.
“Policy changes that have impacted the Buy to Let market in recent years are also likely to have exerted more of a drag in London, given that the private rental sector accounts for a larger proportion of the housing stock in the capital than elsewhere in the country.
“More widely, prices across the South of England (and to a lesser extent in the Midlands) are also well above pre-financial crisis peaks, while those in Northern England, Wales and Scotland are still close to 2007 levels. However, prices in Northern Ireland are still more than 35% below the all-time highs recorded in 2007.”